JavaScript Error and Performance Monitoring

Resolve JavaScript errors with max efficiency, not max effort. Get actionable insights to resolve JavaScript performance issues with the ability to track, debug, and resolve JavaScript errors across platforms.

Getting Started is Simple

Grab the Sentry JavaScript SDK:

Copied!Click to Copy
<script src="https://browser.sentry-cdn.com/latest/bundle.min.js"></script>

Configure your DSN:

Copied!Click to Copy
Sentry.init({
  dsn: 'https://<key>@sentry.io/<project>',
  integrations: [Sentry.browserTracingIntegration()],
  tracesSampleRate: 1.0,
  tracePropagationTargets: ['localhost', /^\/https:\/\/yourserver\.io\/api/],
});

Grab the Sentry React SDK:

Copied!Click to Copy
npm install @sentry/react

Configure your DSN:

Copied!Click to Copy
import React from "react";
import ReactDOM from "react-dom";
import * as Sentry from "@sentry/react";
import App from "./App";

Sentry.init({
  dsn: "https://<key>@sentry.io/<project>",
  integrations: [Sentry.browserTracingIntegration()],
  tracesSampleRate: 1.0,
  tracePropagationTargets: ['localhost', /^https:\/\/yourserver\.io\/api/],
});

ReactDOM.render(<App />, document.getElementById("root"));

Signup and install Sentry with just one line of code:

Copied!Click to Copy
npx @sentry/wizard@latest -i nextjs

Grab the Sentry Vue SDK:

Copied!Click to Copy
npm install @sentry/vue

Configure your DSN:

Copied!Click to Copy
import { createApp } from "vue";
import * as Sentry from "@sentry/vue";

const app = createApp({
  // ...
});

Sentry.init({
  app,
  dsn: "https://<key>@sentry.io/<project>",
  integrations: [Sentry.browserTracingIntegration()],

  // We recommend adjusting this value in production, or using tracesSampler
  // for finer control
  tracesSampleRate: 1.0,
  // Set tracePropagationTargets to control for which URLs distributed tracing should be enabled
  tracePropagationTargets: ['localhost', /^https:\/\/yourserver\.io\/api/],
});

app.mount("#app");

Install with one line of code:

Copied!Click to Copy
npx @sentry/wizard@latest -i angular

Just run this command to sign up for and install Sentry:

Copied!Click to Copy
npx @sentry/wizard@latest -i remix

To use the SDK, initialize Sentry in your Svelte entry point main.js before you bootstrap your Svelte app:

Copied!Click to Copy
// main.js / main.ts

import App from "./App.svelte";

import * as Sentry from "@sentry/svelte";

// Initialize the Sentry SDK here
Sentry.init({
  dsn: "__DSN__",
  release: "my-project-name@2.3.12",

  integrations: [Sentry.browserTracingIntegration()],

  // We recommend adjusting this value in production
  tracesSampleRate: 1.0,

  // Set tracePropagationTargets to control for which URLs distributed tracing should be enabled
  tracePropagationTargets: ['localhost', /^https:\/\/yourserver\.io\/api/],
});

// Then bootstrap your Svelte app
const app = new App({
  target: document.getElementById("app"),
});

export default app;

Install with one line of code:

Copied!Click to Copy
npm install @sentry/electron --save

Configure your SDK:

Copied!Click to Copy
import * as Sentry from "@sentry/electron";
Sentry.init({ dsn: "https://<key>@sentry.io/<project>" });

Grab the Sentry Ember SDK:

Copied!Click to Copy
<script src="https://browser.sentry-cdn.com/10.47.0/bundle.min.js"></script>

Configure your DSN:

Copied!Click to Copy
Sentry.init({
  dsn: 'https://<key>@sentry.io/<project>',
  integrations: [new Sentry.Integrations.Ember()]
});

Just run this command to install and register Sentry's Astro integration:

Copied!Click to Copy
npx astro add @sentry/astro

Just run this command to install and register Sentry's Nuxt integration:

Copied!Click to Copy
npx @sentry/wizard@latest -i nuxt

How to install the JavaScript SDK

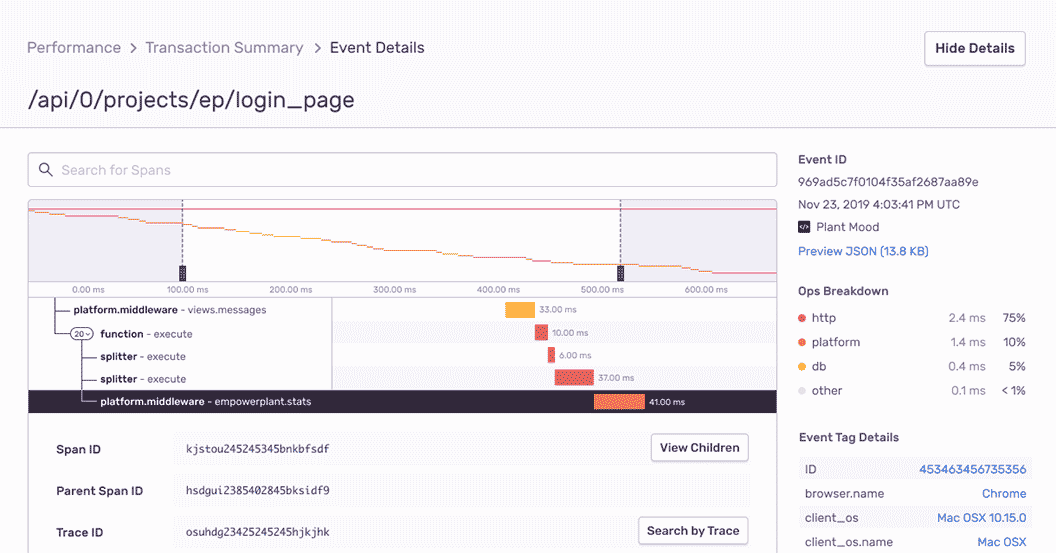
JavaScript Performance Monitoring

Quickly identify JavaScript performance issues before they become downtime. View the entire end-to-end distributed trace to see the exact, poor-performing API call and surface any related errors.
See a Sample Transaction

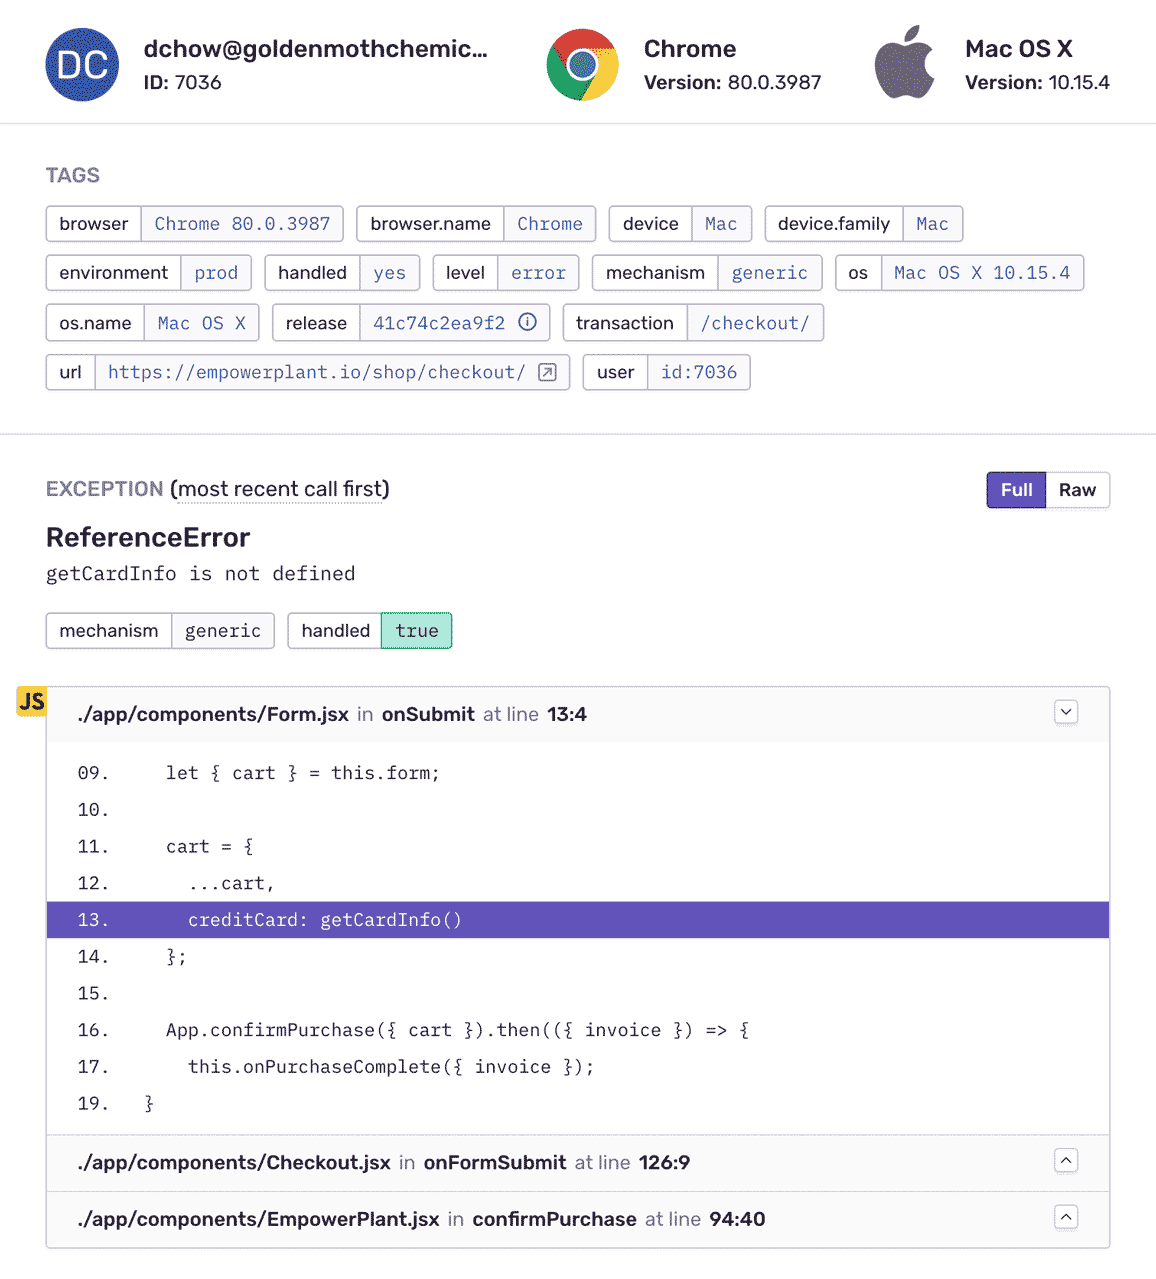
JavaScript Error Monitoring with Complete Stack Traces
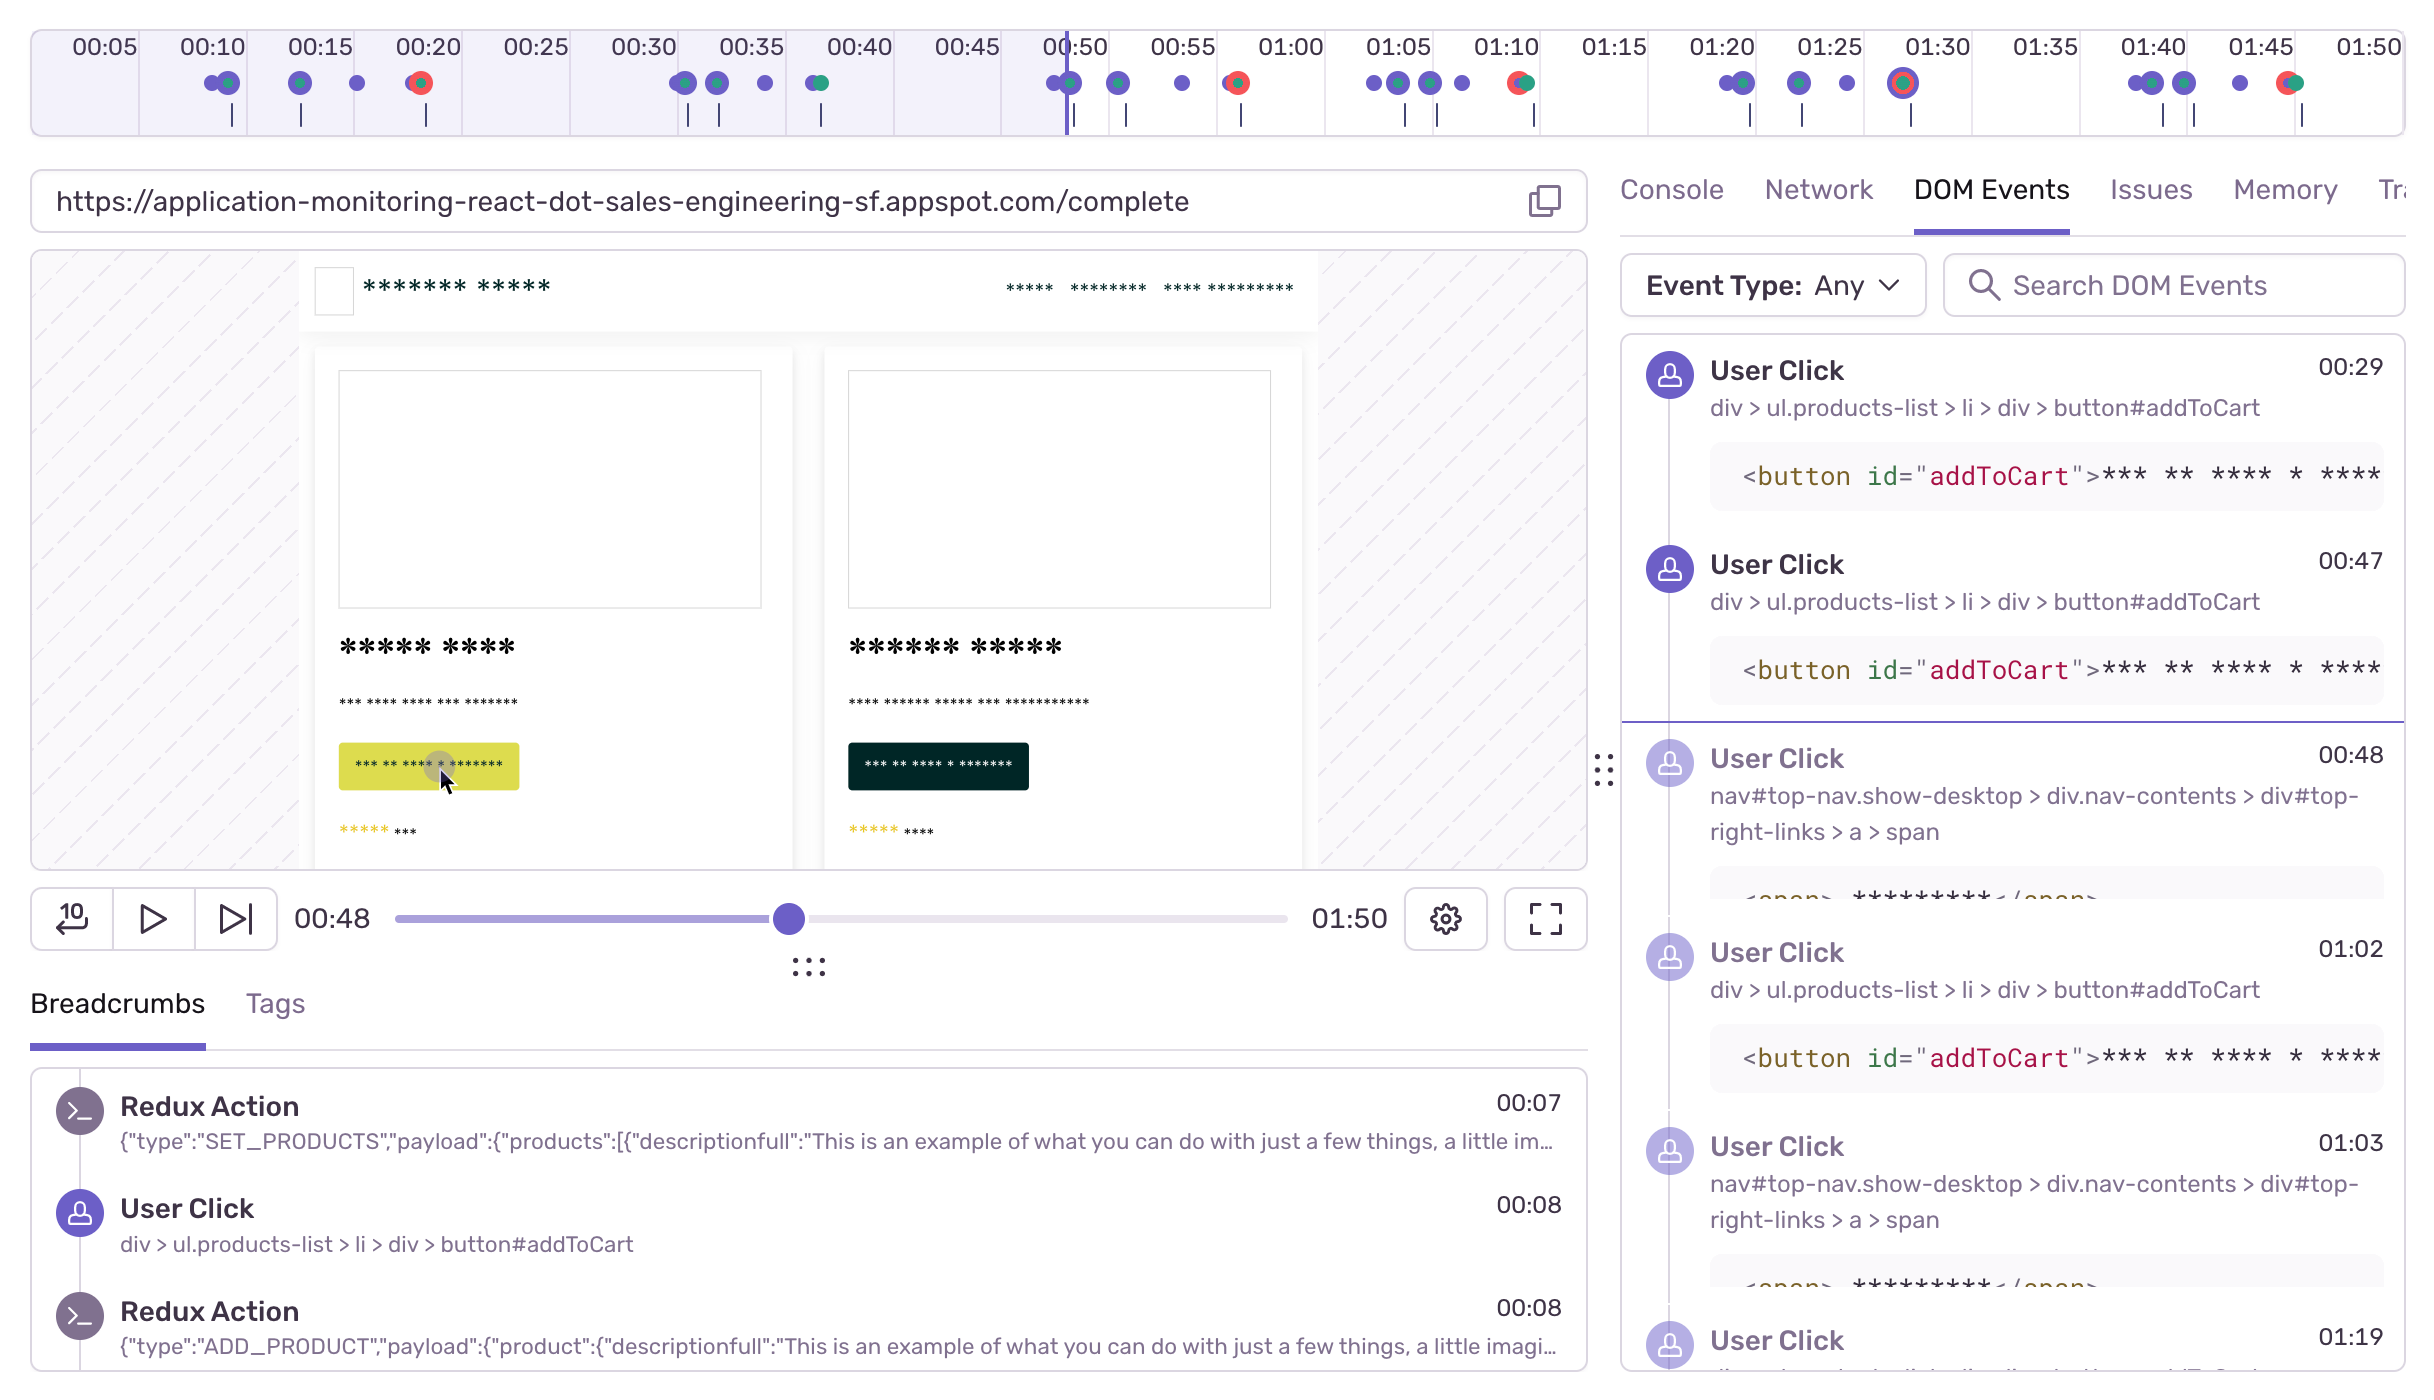
See the error and JavaScript stack trace previously only visible in your user's debug console. Apply source maps automatically to convert minified, compiled, or transpiled code back to its original form. Keep your JavaScript source maps private by uploading them directly to Sentry.
See a Sample Stack Trace

Issues, replayed

Get to the root cause of an error or latency issue faster with context like DOM events, console logs, and network calls within one visual replay on your web application.
Check out Session Replay

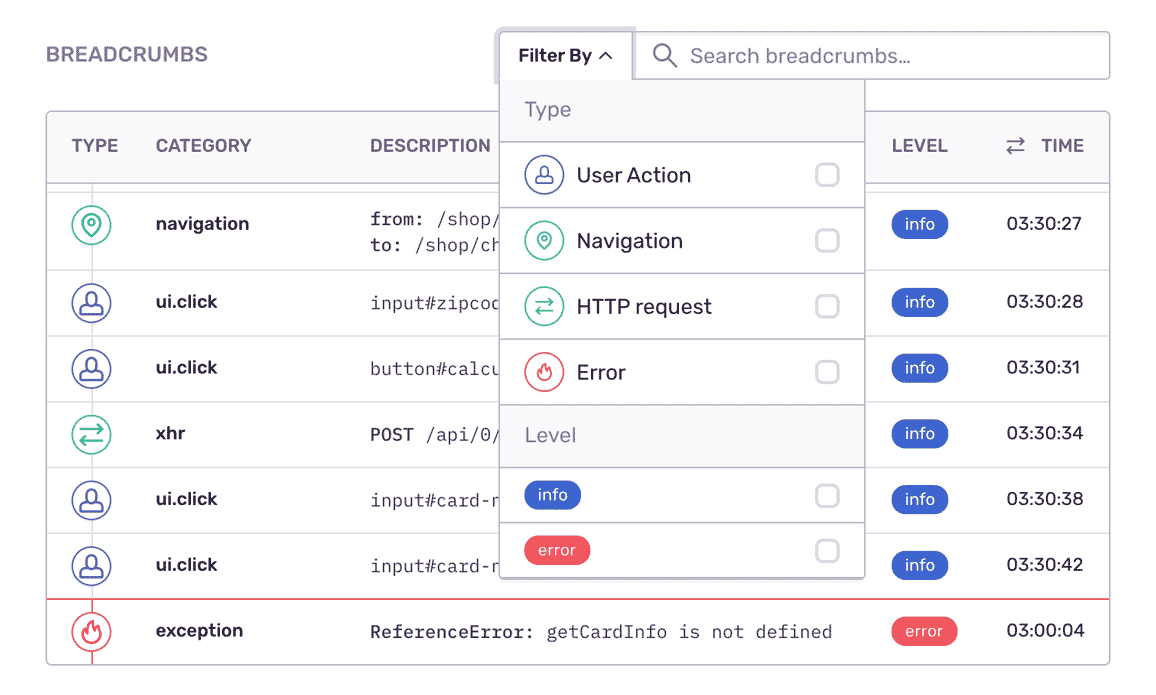
Fill In the Blanks About JavaScript Errors

See what the app was doing when the JavaScript error occurred: user interactions with component names, AJAX requests, console log messages and more. When frontend errors happen, Sentry can prompt users for feedback so you can compare their experiences to the data.
Check out Breadcrumbs

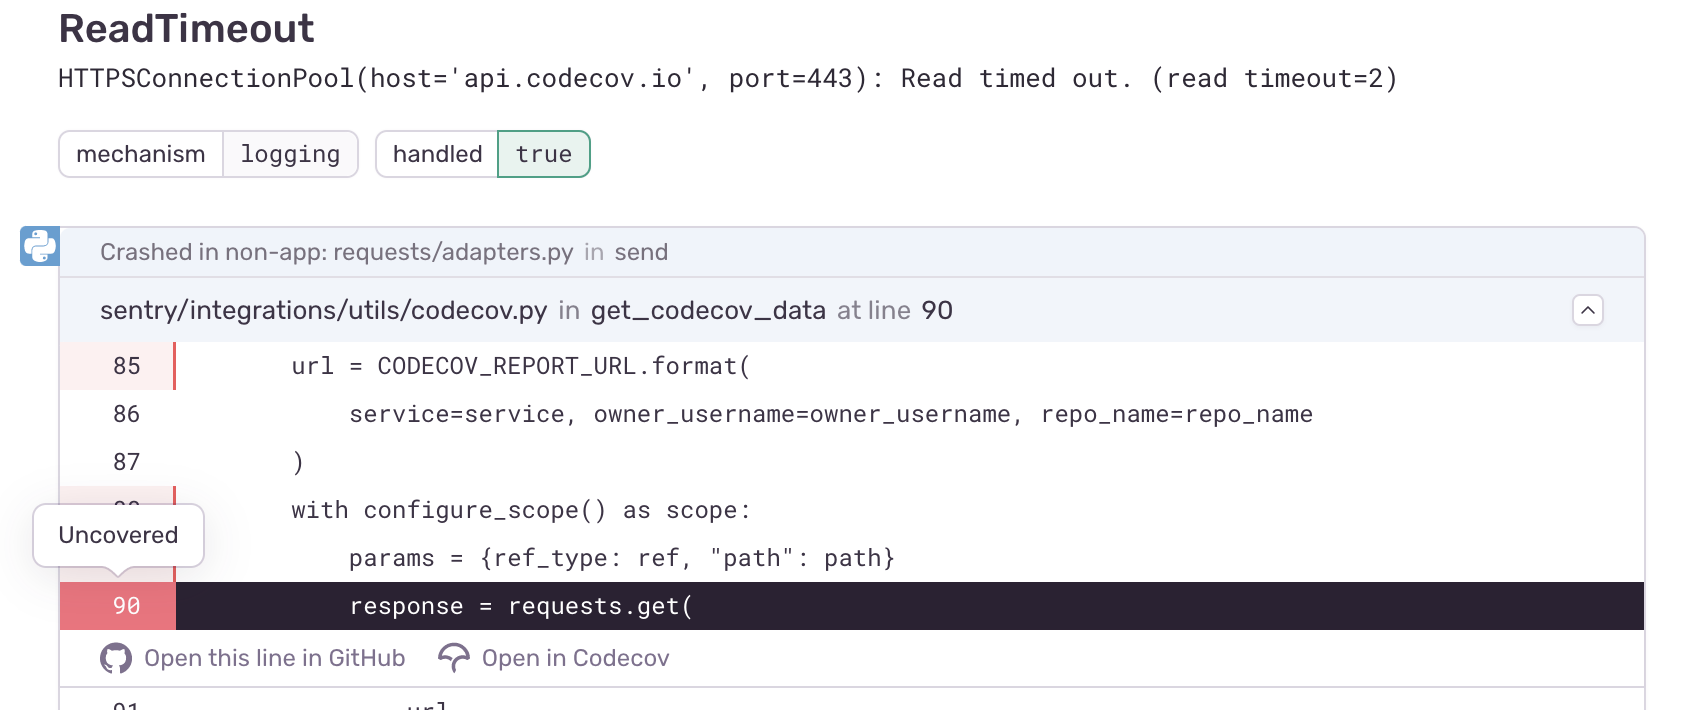
Understand Where Tests Could Prevent Your JavaScript Regressions

Quickly isolate Code Coverage for JavaScript bugs to see where testing could help fix the bug before release with our Codecov integration.
Learn More About Codecov by Sentry

"We were able to catch errors with Sentry before customers could report them or before they hit our support queue."

Ian White
Founder/CEO at ChartHop
ChartHop

See The Full Picture Of Any JavaScript Exception

Record environment and usage details so you can recreate bugs down to the browser version, OS, and query parameters specific to the session.

Sentry's tag distribution graph also makes it easy to isolate and prioritize any JavaScript error by seeing how often it occurs in context.

Answer the most important questions: Was the bug browser or OS specific? Firefox or Safari?

You can't afford to put JavaScript monitoring on the backburner.

Even a one-second delay in loading results in a 7% reduction in conversions.

Forty percent of customers abandon a website that takes longer than three seconds to load.

The average cost of downtime is $5,600 per minute — or $300,000 per hour.

FAQs

Traditional logging provides you with a trail of events. Some of those events are errors, but many times they're simply informational. Sentry is fundamentally different because we focus on exceptions, or in other words, we capture application crashes. We discuss in more detail here and on our blog.

Sentry supports every major frontend language, framework, and library. You can browse each of them here.

You can get started for free. Pricing depends on the number of monthly events, transactions, and attachments that you send Sentry. For more details, visit our pricing page.

Sentry doesn't impact a web site's performance.

If you look at the configuration options for when you initialize Sentry in your code, you'll see there's nothing regarding minimizing its impact on your app's performance. This is because our team of SDK engineers already developed Sentry with this in mind.

Sentry is a listener/handler for errors that asynchronously sends out the error/event to Sentry.io. This is non-blocking. The error/event only goes out if this is an error.

Global handlers have almost no impact as well, as they are native APIs provided by the browsers.

A better experience for your users. An easier life for your developers.