Full Stack Monitoring

Your code is telling you more than what your logs let on. Sentry's full stack monitoring gives you full visibility into your code, so you can catch issues before they become downtime.

Sentry character illustration

Learn about Tracing

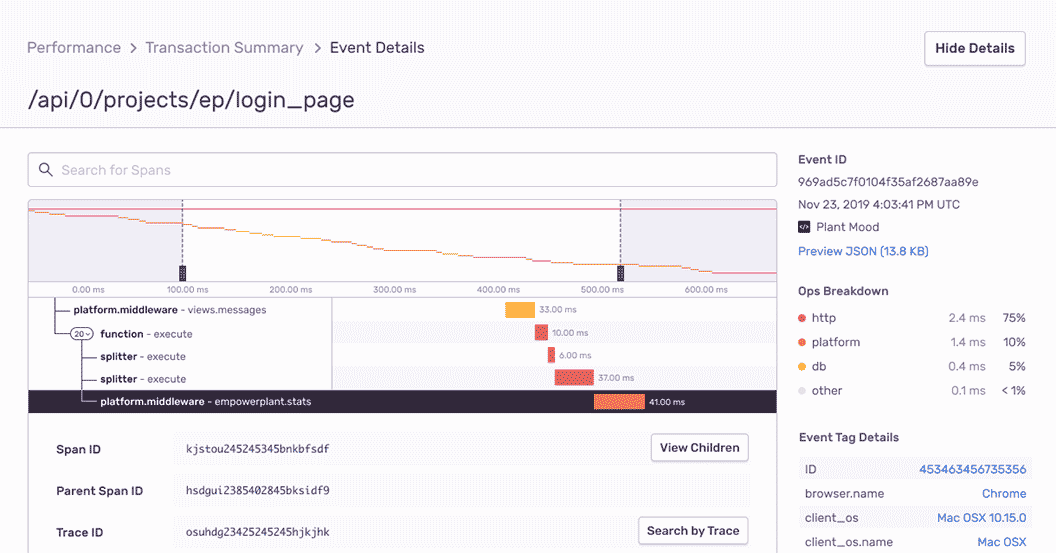
With Sentry's performance monitoring, you can trace performance issues to poor-performing api calls and slow database queries.

Distributed Tracing 101 for Full Stack Developers

Learn the ins-and-outs of distributed tracing and how it can assist you in monitoring the increasingly complex requirements of full stack applications.

Read more

Tracing for the Frontend (to the Backend)

Join Dustin Bailey (Solutions Engineer) as he shows how developers can trace those pesky performance issues to poor-performing API calls & slow database queries across all your services.

Watch now

Find the Root Cause Faster with Trace View and Trace Navigator

Trace View and Trace Navigator give you a throughline between transactions across all your projects.

Read more

Learn about Suspect Spans

Find the slowest operation or "work" taking place on your service. All without having to click into each trace.

Read more

Getting Started is Simple

Grab the Sentry JavaScript SDK:

Copied!Click to Copy
<script src="https://browser.sentry-cdn.com/latest/bundle.min.js"></script>

Configure your DSN:

Copied!Click to Copy
Sentry.init({
  dsn: 'https://<key>@sentry.io/<project>',
  integrations: [Sentry.browserTracingIntegration()],
  tracesSampleRate: 1.0,
  tracePropagationTargets: ['localhost', /^\/https:\/\/yourserver\.io\/api/],
});

Grab the Sentry Node SDK:

Copied!Click to Copy
npm install @sentry/node

Configure your SDK:

Copied!Click to Copy
const Sentry = require('@sentry/node');
Sentry.init({ dsn: 'https://<key>@sentry.io/<project>' });

Grab the Sentry Python SDK:

Copied!Click to Copy
pip install --upgrade sentry-sdk

Configure your DSN:

Copied!Click to Copy
import sentry_sdk

sentry_sdk.init(
    "https://<key>@sentry.io/<project>",

    # Set traces_sample_rate to 1.0 to capture 100%
    # of transactions for Tracing.
    # We recommend adjusting this value in production.
    enable_tracing=True,
    traces_sample_rate=1.0,
)

Install the sentry/sentry package with Composer:

Copied!Click to Copy
composer require sentry/sentry

To capture all errors, even the one during the startup of your application, you should initialize the Sentry PHP SDK as soon as possible.

Copied!Click to Copy
\Sentry\init(['dsn' => 'https://<key>@sentry.io/<project>',
    // Specify a fixed sample rate:
    'traces_sample_rate' => 0.2,
    // Or provide a custom sampler:
    'traces_sampler' => function (\Sentry\Tracing\SamplingContext $context): float {
        // return a number between 0 and 1
    }, ]);

Add the sentry-ruby gem to your Gemfile:

Copied!Click to Copy
gem "sentry-ruby"

Configure your SDK:

Copied!Click to Copy
Sentry.init do |config|
  config.dsn = 'https://<key>@sentry.io/<project>'
  config.traces_sample_rate = 1.0
end

Grab the Sentry Go SDK:

Copied!Click to Copy
go get "github.com/getsentry/sentry-go"

Configuration should happen as early as possible in your application's lifecycle:

Copied!Click to Copy
package main

import (
	"log"
	"time"

	"github.com/getsentry/sentry-go"
)

func main() {
	err := sentry.Init(sentry.ClientOptions{
		Dsn: "https://<key>@sentry.io/<project>",
		EnableTracing: true,
		// Specify a fixed sample rate:
		// We recommend adjusting this value in production
		TracesSampleRate: 1.0,
		// Or provide a custom sample rate:
		TracesSampler: sentry.TracesSampler(func(ctx sentry.SamplingContext) float64 {
			// As an example, this does not send some
			// transactions to Sentry based on their name.
			if ctx.Span.Name == "GET /health" {
				return 0.0
			}

			return 1.0
		}),
	})
	if err != nil {
		log.Fatalf("sentry.Init: %s", err)
	}
	// Flush buffered events before the program terminates.
	// Set the timeout to the maximum duration the program can afford to wait.
	defer sentry.Flush(2 * time.Second)
}

More than 150K organizations trust Sentry with their application monitoring.

Performance waterfall showing distributed trace

Trace. Triage. Triumph.

Errors don't exist in a vacuum. With full-stack monitoring, you can trace frontend errors caused by backend code (and vice versa). Being able to correlate your apm logs with distributed tracing means that you can understand how your stack reacts to your latest deploy or integrating a third-party service.
See a Sample Transaction
Breadcrumbs showing error context

See the sprawl

Humans are visual creatures. Software errors, not so much. Instead of your eyes slogging over logs, Sentry's full stack monitoring shows you a complete picture of what's frustrating your users. Now you can connect those user facing problems on the frontend to impacted services on the backend and fix what matters first.
Check out Breadcrumbs
Issue detail with full stack trace

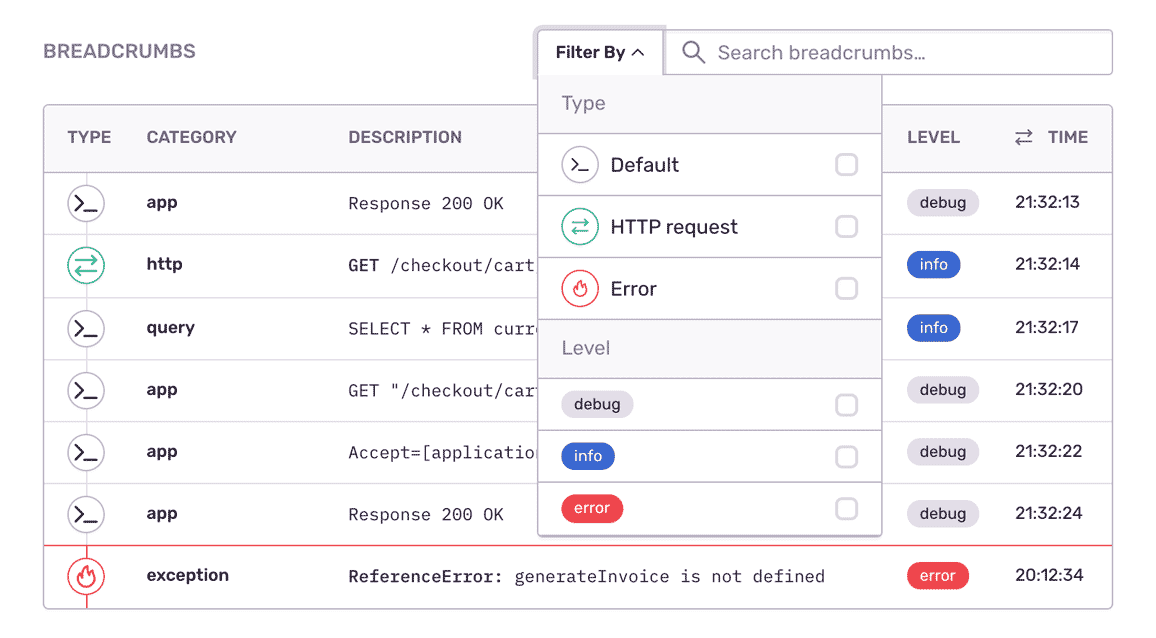
Understand what your code is thinking. Really.

Connecting issues to their root cause doesn't have to be a guessing game. With full-stack monitoring, you get added context about the application state so you're able to quickly understand the impact of specific problems. What's more, all unhandled exceptions are automatically captured, with individual errors rolling up into larger issues.
See a Sample Stack Trace

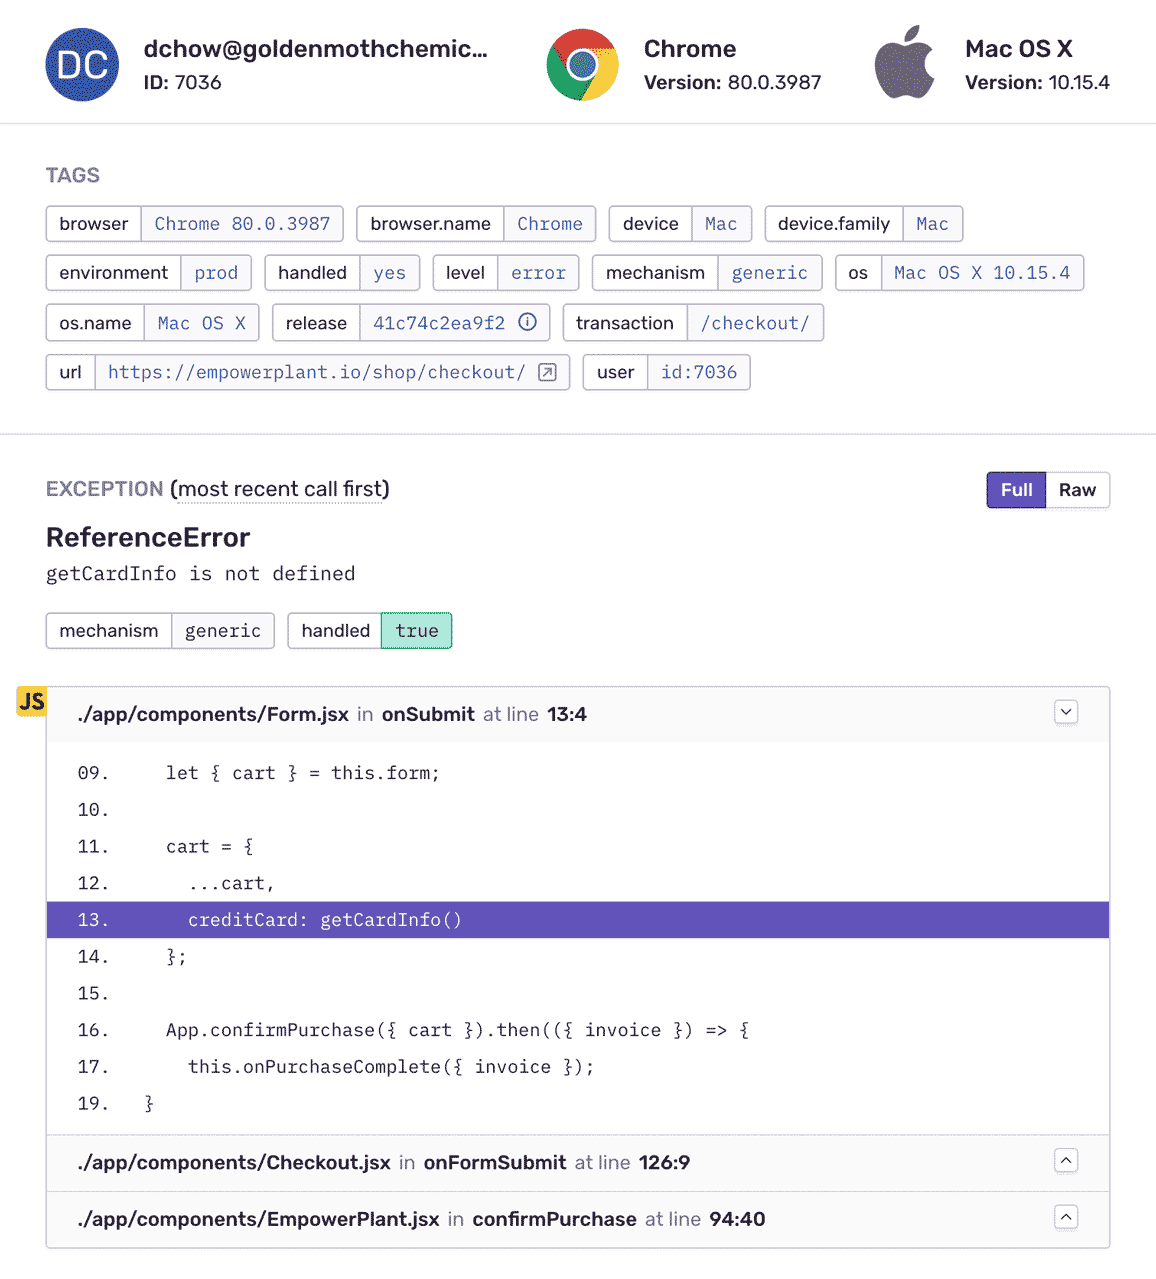
"Sometimes errors on the front-end have roots on the backend. We use Sentry's tags and metadata about a request that comes in to pass along a version of distributed tracing to link these back."

Tony Stuck
Engineering Manager at Cloudflare

FAQs

Traditional logging provides you with a trail of events. Some of those events are errors, but many times they're simply informational. Sentry is fundamentally different because we focus on exceptions, or in other words, we capture application crashes. We discuss in more detail here and on our blog.

Sentry supports every major language, framework, and library. You can browse each of them here.

You can get started for free. Pricing depends on the number of monthly events, transactions, and attachments that you send Sentry. For more details, visit our pricing page.

Sentry doesn't impact a web site's performance.

If you look at the configuration options for when you initialize Sentry in your code, you'll see there's nothing regarding minimizing its impact on your app's performance. This is because our team of SDK engineers already developed Sentry with this in mind.

Sentry is a listener/handler for errors that asynchronously sends out the error/event to Sentry.io. This is non-blocking. The error/event only goes out if this is an error.

Global handlers have almost no impact as well, as they are native APIs provided by the browsers.

A single source of truth — for multiple layers of complexity.