Backend Error Monitoring

Whether you're taming Python's processing power or controlling JavaScript's flow through Node.js, backend infrastructures are as complex as they are valuable.

It's why companies that don't have a complete view of their infrastructure are being punished:

The average cost of network downtime is around $5,600 per minute — or $300,000 per hour.

1 out of 5 online shoppers will abandon their cart because the transaction process was too slow.

On average, a two-second slowdown in page load decreases revenues by 4.3 percent.

Here's how backend monitoring gives you full visibility throughout your dev cycle:

Backend breadcrumbs showing visibility into errors

An extra dimension of visibility.

You can't monitor what you can't see. And there's a lot you need to see in your backend infrastructure, from third-party API data to authentication middleware and data management systems. By giving you complete visibility of your systems no matter where they live, backend monitoring gives you the most complete picture of your infrastructure.
Performance waterfall showing API latency

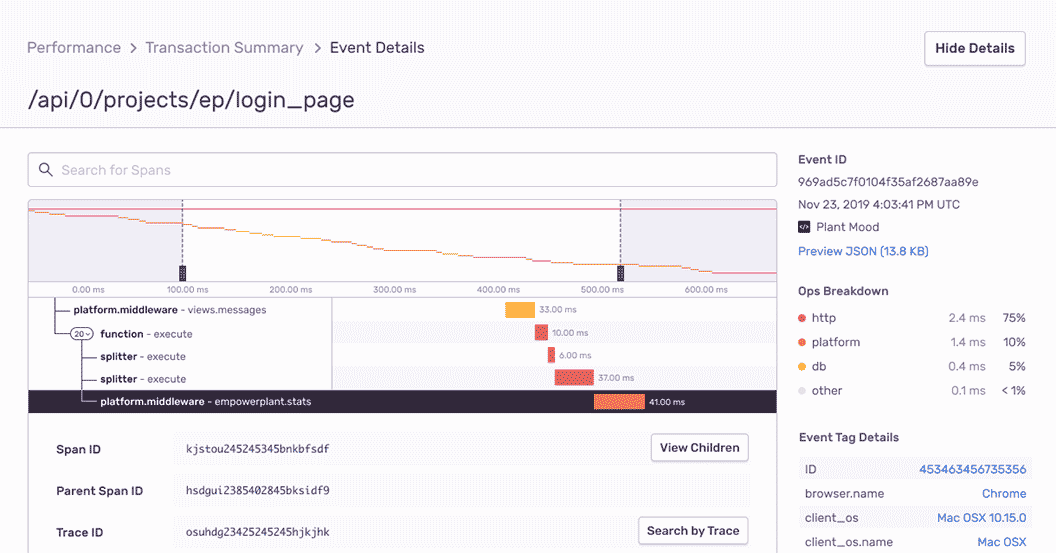
Fix issues before they become downtime.

Your application's performance depends on how well you handle network latency. It's why monitoring how you utilize servers, networks, database instances and storage is critical toward working in a proactive — and not reactive — state.
Stack trace showing error details

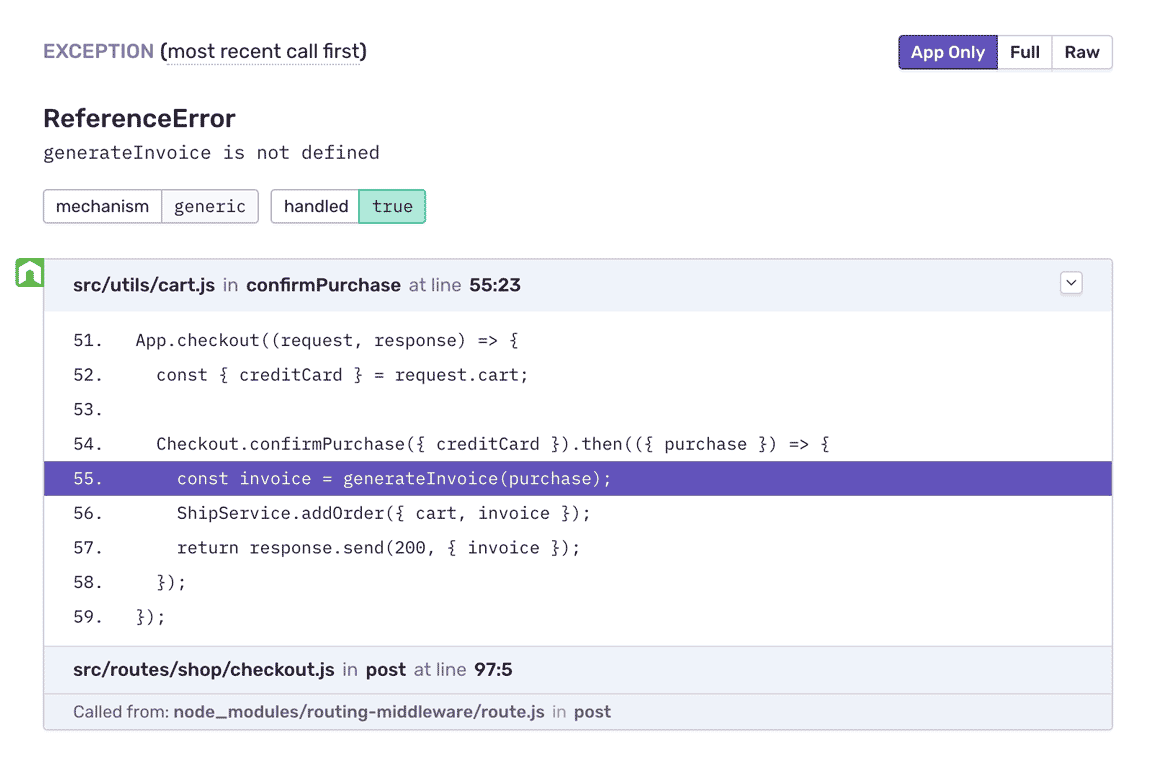
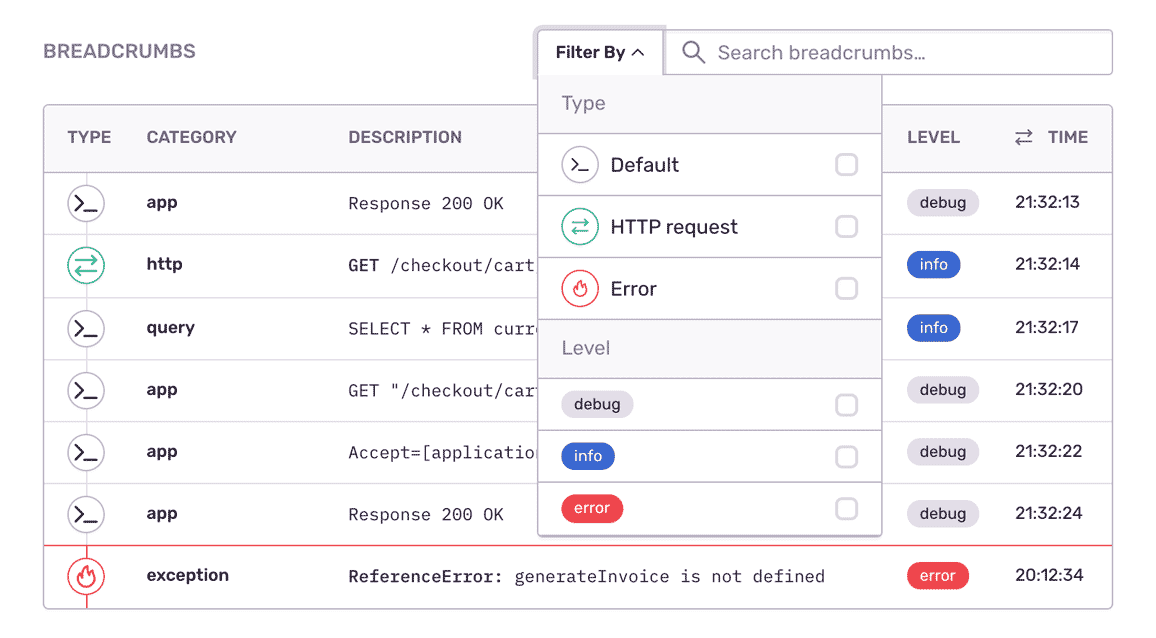
Translate error logs to human insights.

Humans are visual creatures. Compilers, not so much. Error monitoring captures, aggregates and deciphers your error logs in one complete view so you're able to identify key trends and implement future improvements.

Getting Started is Simple

Grab the Sentry Node SDK:

Copied!Click to Copy
npm install @sentry/node

Configure your SDK:

Copied!Click to Copy
const Sentry = require('@sentry/node');
Sentry.init({ dsn: 'https://<key>@sentry.io/<project>' });

Grab the Sentry Python SDK:

Copied!Click to Copy
pip install --upgrade sentry-sdk

Configure your DSN:

Copied!Click to Copy
import sentry_sdk

sentry_sdk.init(
    "https://<key>@sentry.io/<project>",

    # Set traces_sample_rate to 1.0 to capture 100%
    # of transactions for Tracing.
    # We recommend adjusting this value in production.
    enable_tracing=True,
    traces_sample_rate=1.0,
)

Install the sentry/sentry package with Composer:

Copied!Click to Copy
composer require sentry/sentry

To capture all errors, even the one during the startup of your application, you should initialize the Sentry PHP SDK as soon as possible.

Copied!Click to Copy
\Sentry\init(['dsn' => 'https://<key>@sentry.io/<project>',
    // Specify a fixed sample rate:
    'traces_sample_rate' => 0.2,
    // Or provide a custom sampler:
    'traces_sampler' => function (\Sentry\Tracing\SamplingContext $context): float {
        // return a number between 0 and 1
    }, ]);

Add the sentry-ruby gem to your Gemfile:

Copied!Click to Copy
gem "sentry-ruby"

Configure your SDK:

Copied!Click to Copy
Sentry.init do |config|
  config.dsn = 'https://<key>@sentry.io/<project>'
  config.traces_sample_rate = 1.0
end

Grab the Sentry Go SDK:

Copied!Click to Copy
go get "github.com/getsentry/sentry-go"

Configuration should happen as early as possible in your application's lifecycle:

Copied!Click to Copy
package main

import (
	"log"
	"time"

	"github.com/getsentry/sentry-go"
)

func main() {
	err := sentry.Init(sentry.ClientOptions{
		Dsn: "https://<key>@sentry.io/<project>",
		EnableTracing: true,
		// Specify a fixed sample rate:
		// We recommend adjusting this value in production
		TracesSampleRate: 1.0,
		// Or provide a custom sample rate:
		TracesSampler: sentry.TracesSampler(func(ctx sentry.SamplingContext) float64 {
			// As an example, this does not send some
			// transactions to Sentry based on their name.
			if ctx.Span.Name == "GET /health" {
				return 0.0
			}

			return 1.0
		}),
	})
	if err != nil {
		log.Fatalf("sentry.Init: %s", err)
	}
	// Flush buffered events before the program terminates.
	// Set the timeout to the maximum duration the program can afford to wait.
	defer sentry.Flush(2 * time.Second)
}

How to install the Node SDK

How to install the Python SDK

How to install the Ruby SDK

More than 150K Organizations Trust Sentry with Their Application Monitoring

Improve your 99% latency with 1% effort.

Try Sentry's backend monitoring today.